Equations
Equality operator
MetaPost differs from many other programming languages in that it does not use = to assign values to variables, for that we use the assignment operator :=.
The equality operator = is used, just as it is in mathematics, to declare that the right and left hand sides are equal.
Whenever we write = we are specifying equations, and MetaPost will try to resolve them by assigning values to unknown variables to make the equality statement true.
This difference can seem subtle at first: If we write an unassigned variable left of = the solution is simply to assign the value on the right, and thus = works just like := would.
However, having a build in equation solver radically changes how programs are written and its a very powerful component of the MetaPost programming language.
Let's start with an example.
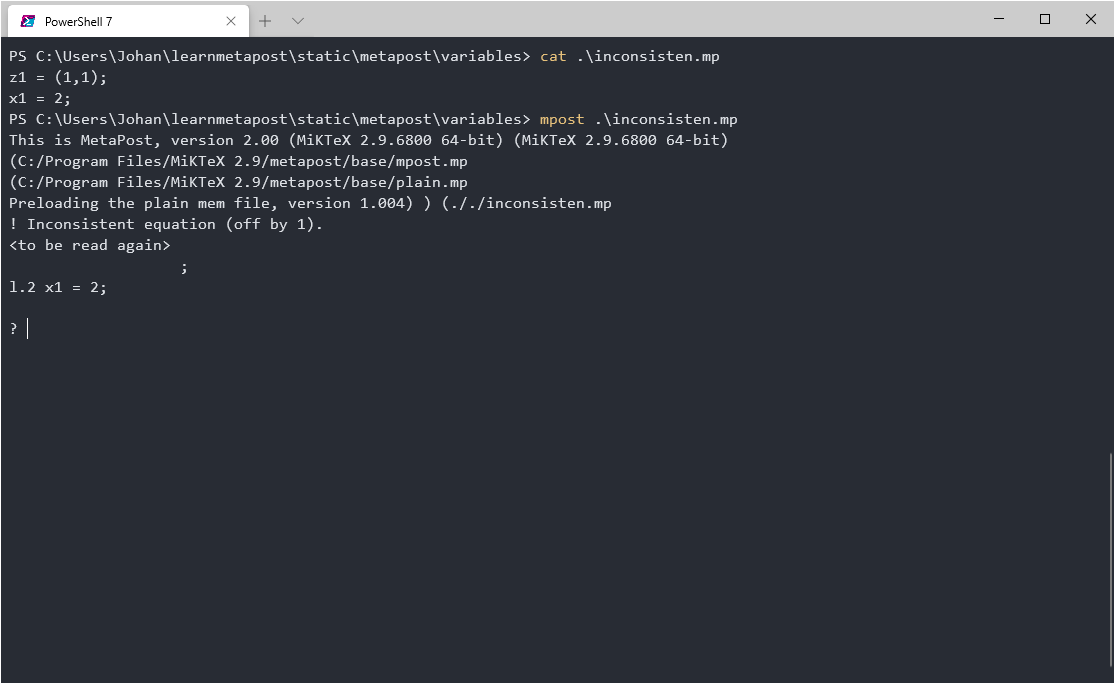
Recall that z1 is shorthand for (x1,y1) and try to run this file:
z1 = (1,1);
x1 = 2;
You will get an Inconsistent equation error, since MetaPost cannot resolve 1=2.
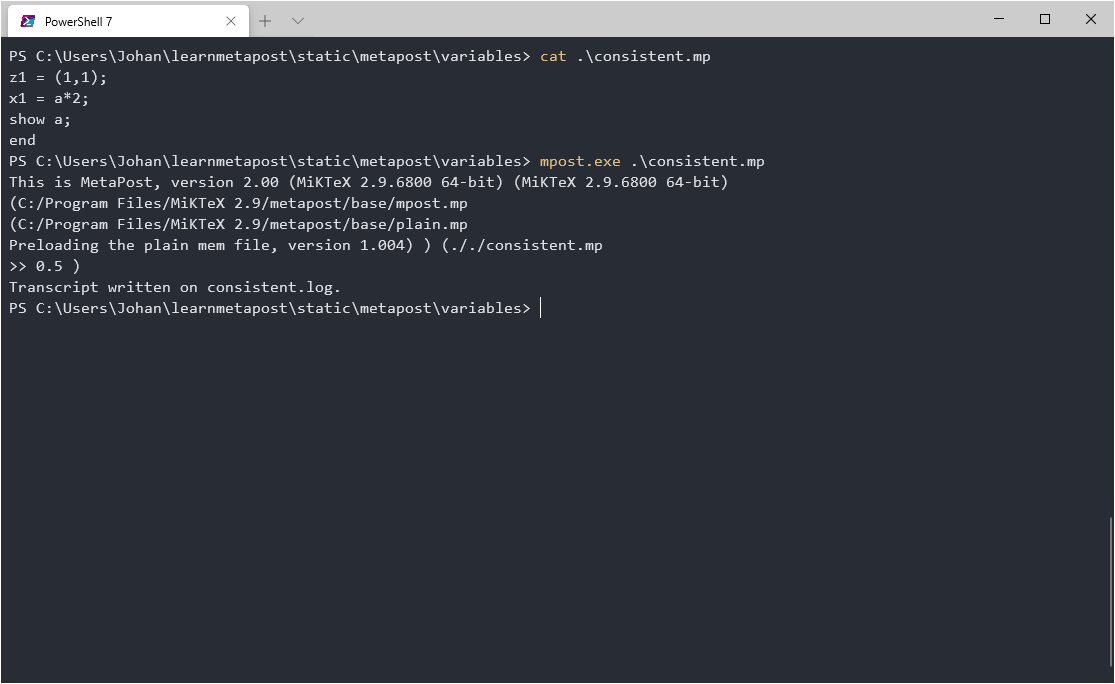
Now try this file instead:
z1 = (1,1);
x1 = a*2;
show a;
end
Here the equation has a solution and MetaPost correctly solves the equation to find the value of the numeric a.
We can use show to make MetaPost print the value in its output.
Drawing a triangle
The build-in equation solver is very useful for drawing figures of mathematical concepts without having to assign absolute positions.
Consider a simple right triangle with points A,B,C and a right angle at C.
If we didn't have an equation solver at hand we might specify something like:
pair A,B,C;
a = b = 1;
C = Origin;
A = C - (a,0);
B = C + (0,b);
However, the right triangle as a concept is not really attached to details like the length of the legs or it's position in the coordinate system. So we can skip those details and just write:
numeric a,b;
pair A,B,C;
A = C - (a,0);
B = C + (0,b);
To actually draw the triangle we would still need to fill in the blanks of course, but when and how is entirely up to us.
We might fix a, b, and C as in the first example, but we are also free to instead fix say A,B and C, or A,B and a,b or any other way.
Whichever way we choose the remaining variables will be assigned by the equation solver and can be used elsewhere.
By delaying these decision we can easily build complex figures that adapt to changes with minimal work.
For example the only difference in the code for the left and right figure below is whether G=C or G=A.
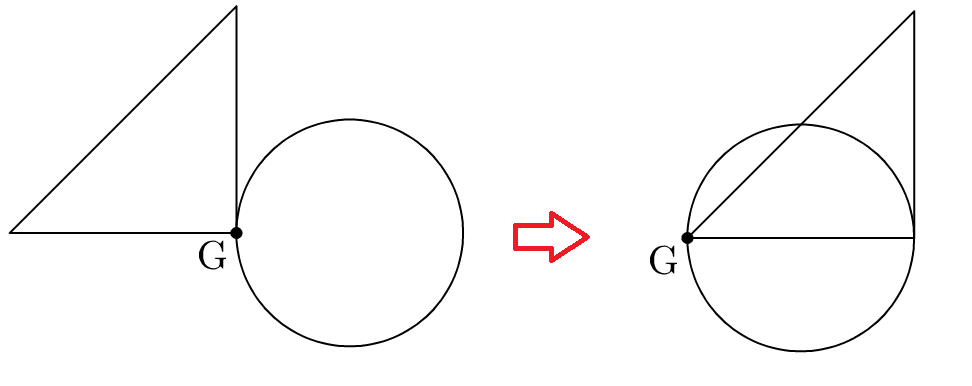
beginfig(1);
  numeric a,b;
  pair A,B,C,G;
  A = C - (a,0);
  B = C + (0,b);
  G = point 4 of fullcircle scaled 2cm;
  a=b=2cm;
  G=A; %Or G=C
  draw A--B--C--cycle;
  draw fullcircle scaled 2cm;
  dotlabel.llft("G",G);
endfig
Intersection
Lets draw a simple X.

beginfig(1);
  z1=-z2=(0.58,1);
  z3=-z4=(-.89,1);
  draw z1--z2;
  draw z3--z4;
endfig
Make sure you understand how equality and negation was used to define the four corners of the cross.
Now lets say we wanted to draw a horizontal line from the point of intersection.
We could of course calculate where the two lines meet, but MetaPost will do it for us.
The syntax fraction[pair1,pair2] denotes the point a fraction along the line from pair1 to pair2.
Using this syntax we specify a point I thats is at some fraction of both lines in the cross, the only solution being the intersection point.
numeric a,b;
pair I;
I = a[z1,z2] = b[z3,z4];
Since we won't need the values of a,b going forward we can avoid declaring them by using the special name whatever to stand in for an anonymous variable.
pair I;
I = whatever[z1,z2] = whatever[z3,z4];

If we want to find intersections between more complicated not-straight paths we can use the (path) intersectionpoint (path) command.
The full code for the crosses above uses a few extra tricks including the dotlabel command and a variable for scaling (u).
outputformat := "png";
outputtemplate := "%j_%c.png";
hppp := 0.25;
vppp := 0.25;
u:=1cm;
pair a,b,c,d;
a=-b=(0.58u,1u);
c=-d=(-.89u,1u);


beginfig(1);
  draw a--b;
  draw c--d;
endfig;

beginfig(2);
  draw a--b;
  draw c--d;

  pair I;
  I = whatever[a,b] = whatever[c,d];

  draw I--(I+(1u,0));
  dotlabel.top("I",I);
endfig
end
Exercise
Use what you have seen to draw the following figure:

To draw labeled dots you can use the dotlabel command along with the controls |lft|rt|top|bot|ulft|urt|llft|lrt to
set the relative location of a label like so:
dotlabel.rt("label",pair)
Hint
beginfig(3)
  z1=(0,-0.5u);
  z2=(-0.5u,1u);
  z3=(-1u,0.2u);
  z4=(1u,0.2u);
  z5=z3+(0,0.5u);
  z6=z4+(0,0.5u);
  draw z1--z2;
  draw z3--z4;
  draw z5--z6;

  pair a,b;
  a = whatever[z1,z2]=whatever[z3,z4];
  b = whatever[z1,z2]=whatever[z5,z6];

  dotlabel.urt("a",a);
  dotlabel.urt("b",b);
endfig